Controls
Mobile modeMethodology
Twenty years of real launches taught me a process that holds its shape under pressure: structured enough to keep a team aligned, loose enough to follow the evidence when it surprises you.
It carries a team from fuzzy early alignment to confident shipping, with research and iteration at every stage, and the people who'll actually use the product in the room, not just at the kickoff.
The goal never changes: build the right thing, for the right reasons, with the people it's for, and craft it with care.
Methodology
Twenty years of real launches taught me a process that holds its shape under pressure: structured enough to keep a team aligned, loose enough to follow the evidence when it surprises you.
It carries a team from fuzzy early alignment to confident shipping, with research and iteration at every stage, and the people who'll actually use the product in the room, not just at the kickoff.
The goal never changes: build the right thing, for the right reasons, with the people it's for, and craft it with care.
Below is a collection of the exercises, workshops, and artifacts I've used across a wide range of projects. Some teams need only a few of these tools; others require a complete end-to-end approach.
The point is to apply the right level of support at the right moment, nothing more, nothing less.

Phase 1
Catalyst
- •Vision Alignment Workshops
- •Strategic Direction Synthesis
- •Target Demographic Framing (Proto-Persona Framing)
- •Current State Journey Maps
- •Product Design Principles

Phase 2
Explore & Understand
- •Design Thinking Workshops
- •User Research
- •Persona Creation
- •Experience Architecture
- •Target State Journey Maps
- •Vision Wireframes

Phase 3
Design & Validate
- •Interactive Prototypes
- •Usability Testing
- •Prioritization Assessment
- •Target State Architecture
- •Proof of Concept
- •Concept Testing

Phase 4
Activate
- •High Fidelity Screen Design
- •User Stories
- •Agile Iterative Releases
- •Ongoing User Feedback
- •Target Journey Updates
- •Prioritization Assessment
- •Backlog Management
Phase 1
Catalyst
- •Vision Alignment Workshops
- •Strategic Direction Synthesis
- •Target Demographic Framing (Proto-Persona Framing)
- •Current State Journey Maps
- •Product Design Principles
Phase 2
Explore & Understand
- •Design Thinking Workshops
- •User Research
- •Persona Creation
- •Experience Architecture
- •Target State Journey Maps
- •Vision Wireframes
Phase 3
Design & Validate
- •Interactive Prototypes
- •Usability Testing
- •Prioritization Assessment
- •Target State Architecture
- •Proof of Concept
- •Concept Testing
Phase 4
Activate
- •High Fidelity Screen Design
- •User Stories
- •Agile Iterative Releases
- •Ongoing User Feedback
- •Target Journey Updates
- •Prioritization Assessment
- •Backlog Management
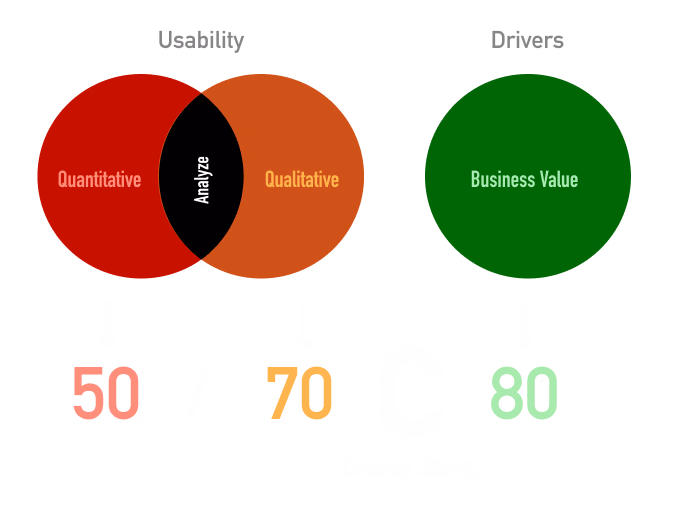
Measuring Experiences
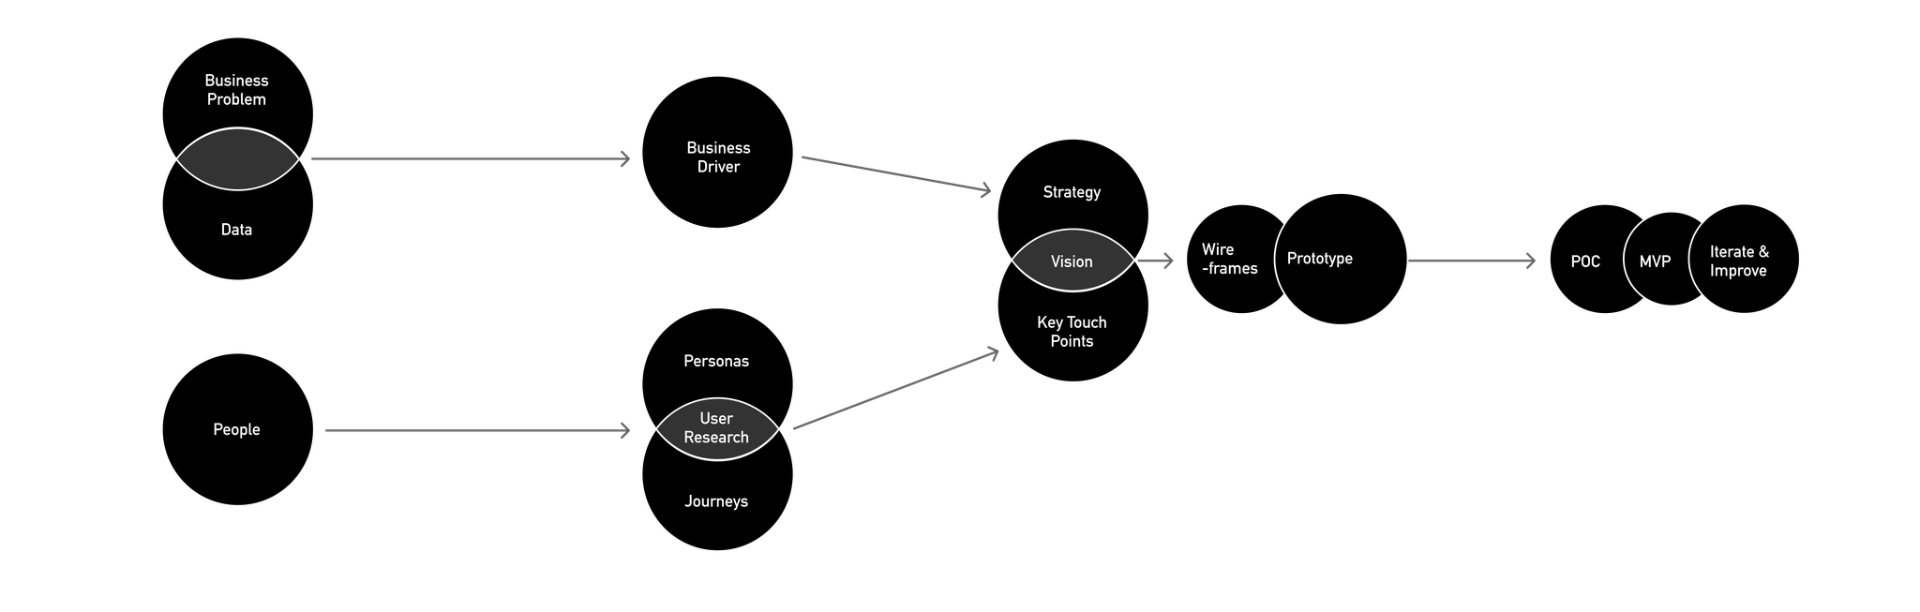
Effective solutions hinge on simultaneously providing unique value to users while contributing to your business's bottom line. To tackle this challenge, you need a deep understanding of business drivers, relevant data sets, and how people interact within the problem space. Once you have your frame, you can establish the metrics you want to impact and set up a way to continuously measure against these KPIs (Key Performance Indicators). These metrics give you the space to work within to craft your solution. Within this defined solution space, you do targeted research, hypothesize, test, and refine your solution using various tactics, including HCD, Lean, Design Thinking, and Agile.
Measuring experiences within an organization involves three key elements: quantitative analytics, qualitative usability assessments, and business value. Quantitative analytics offer objective metrics on user interactions, such as click-through rates and conversion rates, providing a data-driven view of user behavior. Qualitative assessments gather user feedback through surveys and usability testing, offering insights into satisfaction and pain points. Business value is measured by aligning user experience with organizational goals and its impact on metrics like revenue growth and customer retention. Together, these elements provide a holistic view of product performance, guiding decisions to enhance user satisfaction and achieve business objectives.